
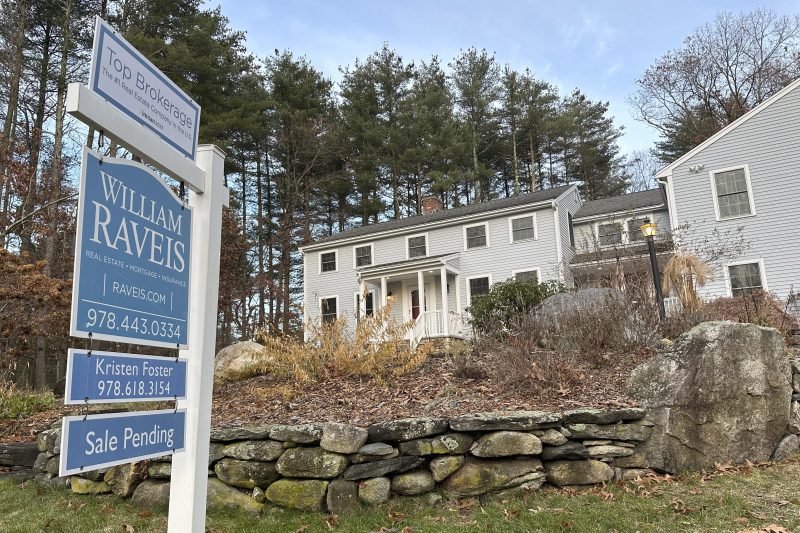
(NEXSTAR) – Most of us know we can’t afford a home in Beverly Hills or Cape Cod, but it’s not just wealthy enclaves where the prospect of owning a home has grown out of reach.
As home prices have skyrocketed over the past few years, locals – who haven’t seen their wages skyrocket to match – are finding it harder and harder to enter the housing market.
Personal finance site MoneyGeek analyzed the rising cost of real estate in metro areas around the country and compared home appreciation between 2021 and 2023 to changes in income during the same time period. They compiled a list of 57 counties were homeownership has recently become unaffordable for the typical family.
New to the list are the exurbs of San Francisco and several Sacramento-area counties. People priced out of the core Bay Area have flocked to other Northern California locales, and now those places, like Placer, Solano and San Joaquin counties, are seeing home prices spike out of reach.
Further north along the West Coast, 10 counties in Oregon and Washington are facing the same problem. In Clackamas County, just outside Portland, home prices have grown 33% in two years, according to MoneyGeek’s analysis.
Another area seeing rapid growth and gentrification is Travis County, Texas, home to the state capital of Austin. MoneyGeek found home prices there rose by nearly 50% since 2021 to a new median price of $610,000.
For their analysis, MoneyGeek only looked at counties with populations larger than 250,000 that are experiencing population growth higher than the national average.
See the full list of 57 counties where the cost of owning a home has grown “unaffordable” below:
| Rank | County | Metro area | Median household income | Median home price | Home price growth in last 2 years |
| 1 | Placer County, CA | Sacramento–Roseville–Arden-Arcade, CA | $105,445 | $740,068 | 25.9% |
| 2 | Norfolk County, MA | Boston-Cambridge-Newton, MA-NH | $115,969 | $740,967 | 34.0% |
| 3 | Washoe County, NV | Reno, NV | $80,125 | $568,847 | 33.9% |
| 4 | San Joaquin County, CA | Stockton-Lodi, CA | $86,056 | $553,133 | 29.7% |
| 5 | Clackamas County, OR | Portland-Vancouver-Hillsboro, OR-WA | $97,419 | $639,349 | 33.4% |
| 6 | Solano County, CA | Vallejo-Fairfield, CA | $92,959 | $633,442 | 27.6% |
| 7 | Lane County, OR | Eugene, OR | $64,069 | $461,421 | 40.5% |
| 8 | Contra Costa County, CA | San Francisco-Oakland-Hayward, CA | $120,061 | $875,183 | 40.7% |
| 9 | Washington County, OR | Portland-Vancouver-Hillsboro, OR-WA | $98,906 | $598,213 | 25.8% |
| 10 | Essex County, MA | Boston-Cambridge-Newton, MA-NH | $92,413 | $650,959 | 30.2% |
| 11 | Sacramento County, CA | Sacramento–Roseville–Arden-Arcade, CA | $84,211 | $550,422 | 28.3% |
| 12 | Larimer County, CO | Fort Collins, CO | $88,403 | $639,709 | 44.0% |
| 13 | Denver County, CO | Denver-Aurora-Lakewood, CO | $88,213 | $681,243 | 41.1% |
| 14 | Marion County, OR | Salem, OR | $71,022 | $439,919 | 37.6% |
| 15 | Ada County, ID | Boise City, ID | $87,774 | $572,812 | 42.1% |
| 16 | Essex County, NJ | New York-Newark-Jersey City, NY-NJ-PA | $74,994 | $543,648 | 29.2% |
| 17 | Travis County, TX | Austin-Round Rock, TX | $95,259 | $609,625 | 49.9% |
| 18 | Riverside County, CA | Riverside-San Bernardino-Ontario, CA | $86,748 | $609,299 | 42.8% |
| 19 | Merced County, CA | Merced, CA | $66,164 | $430,766 | 38.2% |
| 20 | Plymouth County, MA | Boston-Cambridge-Newton, MA-NH | $103,173 | $578,535 | 35.9% |
| 21 | Fresno County, CA | Fresno, CA | $69,571 | $424,915 | 34.2% |
| 22 | Snohomish County, WA | Seattle-Tacoma-Bellevue, WA | $101,532 | $759,090 | 47.9% |
| 23 | Worcester County, MA | Worcester, MA-CT | $86,258 | $464,541 | 36.7% |
| 24 | Kitsap County, WA | Bremerton-Silverdale, WA | $94,775 | $565,134 | 33.4% |
| 25 | Salt Lake County, UT | Salt Lake City, UT | $91,924 | $588,713 | 43.8% |
| 26 | Spokane County, WA | Spokane-Spokane Valley, WA | $69,070 | $470,279 | 56.1% |
| 27 | Arapahoe County, CO | Denver-Aurora-Lakewood, CO | $93,784 | $605,759 | 36.8% |
| 28 | Dane County, WI | Madison, WI | $84,831 | $432,643 | 38.7% |
| 29 | Clark County, NV | Las Vegas-Henderson-Paradise, NV | $70,797 | $479,988 | 41.8% |
| 30 | Charleston County, SC | Charleston-North Charleston, SC | $80,401 | $557,579 | 51.0% |
| 31 | Utah County, UT | Provo-Orem, UT | $95,338 | $609,398 | 49.8% |
| 32 | Clark County, WA | Portland-Vancouver-Hillsboro, OR-WA | $91,248 | $543,165 | 35.0% |
| 33 | Thurston County, WA | Olympia-Tumwater, WA | $88,853 | $533,152 | 41.2% |
| 34 | Fulton County, GA | Atlanta-Sandy Springs-Roswell, GA | $90,346 | $538,765 | 38.3% |
| 35 | Collier County, FL | Naples-Immokalee-Marco Island, FL | $80,815 | $657,623 | 63.8% |
| 36 | Pierce County, WA | Seattle-Tacoma-Bellevue, WA | $93,420 | $575,639 | 46.4% |
| 37 | Davidson County, TN | Nashville-Davidson–Murfreesboro–Franklin, TN | $72,473 | $489,829 | 54.7% |
| 38 | El Paso County, CO | Colorado Springs, CO | $82,389 | $501,128 | 38.1% |
| 39 | Broward County, FL | Miami-Fort Lauderdale-West Palm Beach, FL | $70,978 | $500,480 | 52.9% |
| 40 | Cumberland County, ME | Portland-South Portland, ME | $89,345 | $526,852 | 57.7% |
| 41 | Williamson County, TN | Nashville-Davidson–Murfreesboro–Franklin, TN | $129,275 | $862,333 | 61.9% |
| 42 | Buncombe County, NC | Asheville, NC | $68,019 | $464,935 | 56.0% |
| 43 | Palm Beach County, FL | Miami-Fort Lauderdale-West Palm Beach, FL | $76,592 | $524,918 | 54.7% |
| 44 | Alachua County, FL | Gainesville, FL | $58,354 | $338,834 | 42.8% |
| 45 | Williamson County, TX | Austin-Round Rock, TX | $101,323 | $520,953 | 54.6% |
| 46 | Hays County, TX | Austin-Round Rock, TX | $88,617 | $464,991 | 54.3% |
| 47 | Manatee County, FL | North Port-Sarasota-Bradenton, FL | $72,108 | $476,592 | 58.4% |
| 48 | Canyon County, ID | Boise City, ID | $70,818 | $439,226 | 60.3% |
| 49 | St. Lucie County, FL | Port St. Lucie, FL | $62,705 | $397,522 | 59.2% |
| 50 | Orange County, FL | Orlando-Kissimmee-Sanford, FL | $72,324 | $445,503 | 54.5% |
| 51 | Maricopa County, AZ | Phoenix-Mesa-Scottsdale, AZ | $83,747 | $516,442 | 53.5% |
| 52 | Sarasota County, FL | North Port-Sarasota-Bradenton, FL | $78,341 | $508,658 | 67.1% |
| 53 | Mecklenburg County, NC | Charlotte-Concord-Gastonia, NC-SC | $80,365 | $471,823 | 58.6% |
| 54 | Osceola County, FL | Orlando-Kissimmee-Sanford, FL | $63,271 | $396,311 | 58.3% |
| 55 | Lee County, FL | Cape Coral-Fort Myers, FL | $71,072 | $440,056 | 64.0% |
| 56 | Durham County, NC | Durham-Chapel Hill, NC | $80,089 | $452,381 | 71.4% |
| 57 | Hillsborough County, FL | Tampa-St. Petersburg-Clearwater, FL | $74,308 | $436,723 | 60.3% |
See more data on each of the 57 counties from MoneyGeek here.
One thing that’s made homeownership unrealistic for many the past two years has been climbing interest rates. However, housing economists expect that the average rate on a 30-year mortgage will decline this year. Don’t expect anything drastic — forecasts generally see it moving no lower than 6%.
Despite mostly falling since October 2023, the average rate on a 30-year home loan remains sharply higher than just two years ago, when it was 3.22%. That large gap between rates now and then has helped limit the number of previously occupied homes on the market by discouraging homeowners who locked in rock-bottom rates from selling.
“While lower mortgage rates are welcome news, potential homebuyers are still dealing with the dual challenges of low inventory and high home prices that continue to rise,” said Sam Khater, Freddie Mac’s chief economist.
The Associated Press contributed to this report.